How to Read a Psychrometric Chart
Published on May 23, 2023,
by

Understanding air properties is essential for optimizing HVAC performance and indoor climate control. One of the most powerful tools for this is the psychrometric chart. If you’re new to reading psychrometric charts, this guide will help you decode the lines, curves, and intersections that represent temperature, humidity, enthalpy, and more, giving you the confidence to analyze air conditions and make smarter environmental decisions
This article will guide you on how to read a psychrometric chart step-by-step.
Basic Properties on the Chart
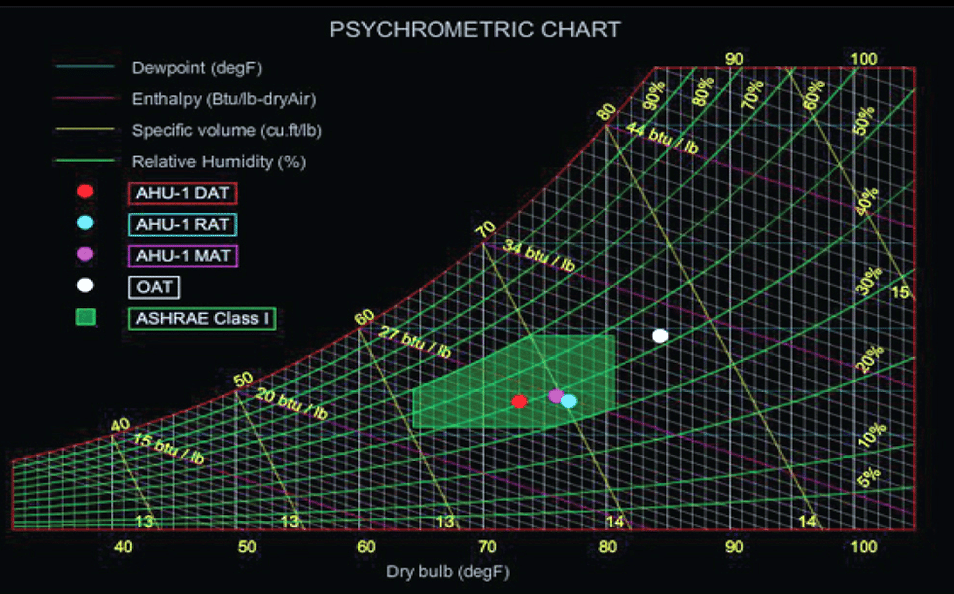
Dry bulb temperature (DBT): This is the "normal" temperature we measure with a standard thermometer, measured in degrees Celsius or Fahrenheit. It is typically plotted along the x-axis at the bottom of the chart.
Wet bulb temperature (WBT): This is the lowest temperature achievable by evaporative cooling, typically measured by a thermometer wrapped in a moist cloth. WBT lines are diagonal, moving from the lower left to the upper right.
Relative humidity (RH): This is the ratio of the current absolute humidity to the highest possible absolute humidity at that particular temperature. RH is depicted as curved lines that emanate from the bottom left of the chart and end on the saturation curve (100% relative humidity).
Specific volume: This measures the volume a certain weight of air would occupy at a specific temperature. It's represented by hyperbolic lines on the chart.
Enthalpy: This is the total heat content of air, often referred to as total heat. It is measured in Btu per pound of dry air and is depicted by diagonal lines moving from the lower left to the upper right.
Dew point temperature: This is the temperature at which air becomes saturated, and condensation begins to form. The dew point temperature is found along the 100% RH line.
Reading the Chart
- Locate the Dry Bulb Temperature: Start by finding the dry bulb temperature on the x-axis at the bottom of the chart.
- Find the Relative Humidity: If you know the relative humidity, follow the curved line of the respective value from the dry bulb temperature. The point where the relative humidity curve intersects the vertical line from the dry bulb temperature gives the condition point.
- Find the Wet Bulb or Dew Point Temperature: Follow the diagonal line from the condition point to the saturation line (100% relative humidity) to find the dew point temperature. If you know the wet bulb temperature, find the diagonal line corresponding to this temperature and follow it until it intersects the vertical line from the dry bulb temperature to get the condition point.
- Identify the Specific Volume and Enthalpy: The specific volume and enthalpy can be read at the condition point. The specific volume is read along the vertical axis to the right, and the enthalpy along the diagonal lines from the lower left to the upper right.
- Determine Changes in State: If air is heated, cooled, humidified, or dehumidified, this change can be plotted on the chart. Heating and cooling are represented as horizontal lines (left for cooling, right for heating). Humidifying or dehumidifying processes are represented as vertical lines (up for humidifying, down for dehumidifying).
Understanding a psychrometric chart can seem complex at first, but with practice, it becomes a useful tool for evaluating HVAC system performance, determining indoor environmental comfort, or even assessing drying processes in the food and material industries. The chart provides a graphical representation of the air condition properties, simplifying complex calculations related to heating, cooling, humidification, and dehumidification processes.
Additional Resources
CARRIER Psychrometrics (free version) download for PC (freedownloadmanager.org)
Most Recent Related Stories


Request a Demo Today